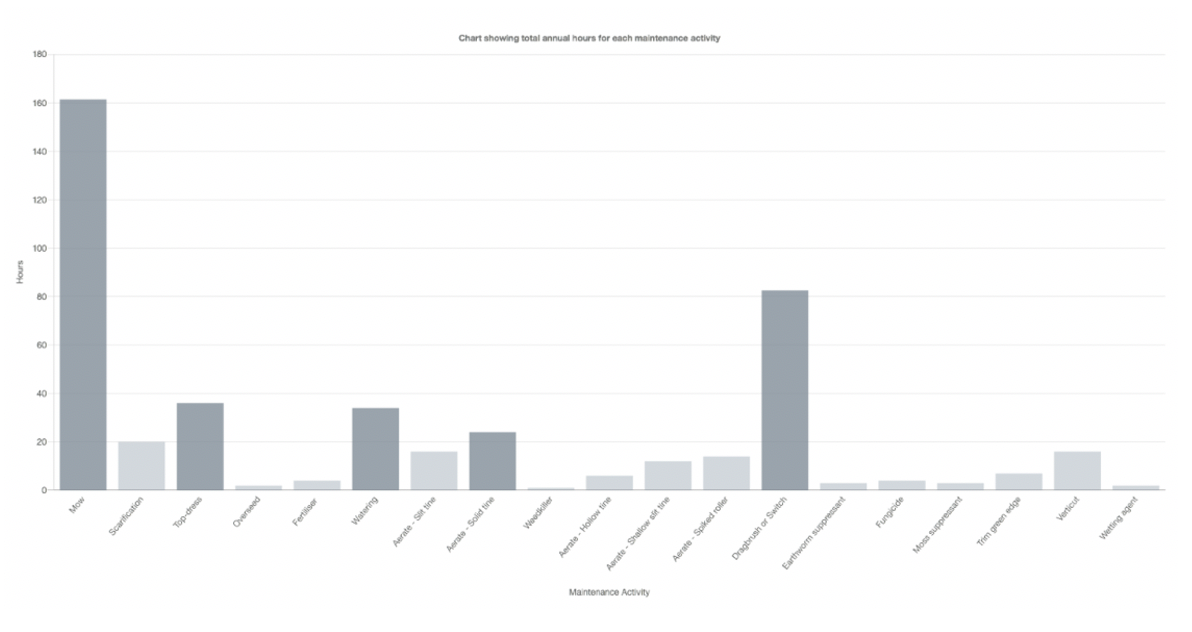
Bowling Green Maintenance: 37. Total Input Hours per Activity 
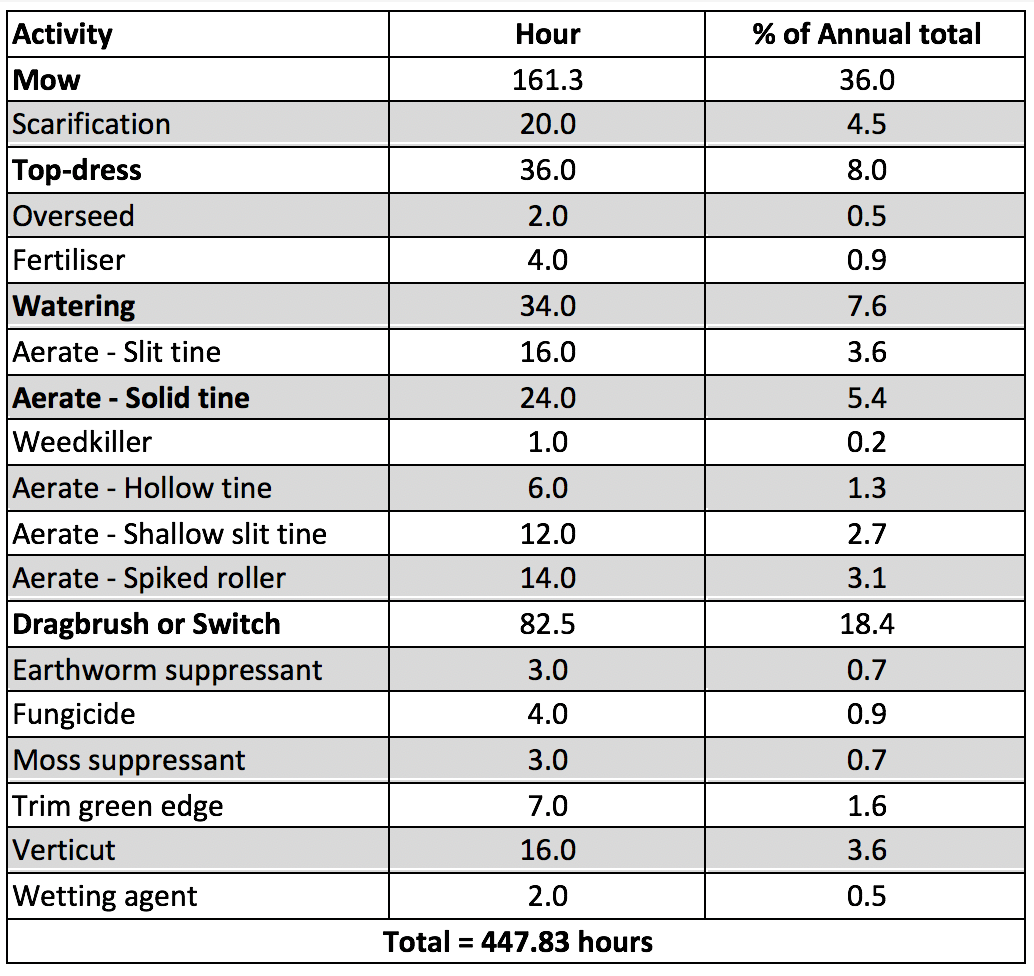
The following data table provides further detail for the inputs for all the different maintenance activities in example 2 in the Total Input Hours per Month chart.
A bar chart (for this example 2) can visually pick out the key maintenance activities, with the top five given above being highlighted as a darker grey bar.