Module 2:

Pitch quality

2.3 Assessing Pitch Quality

2.3.4 Assessing your own pitch

1 Guidance for completing a worksheet

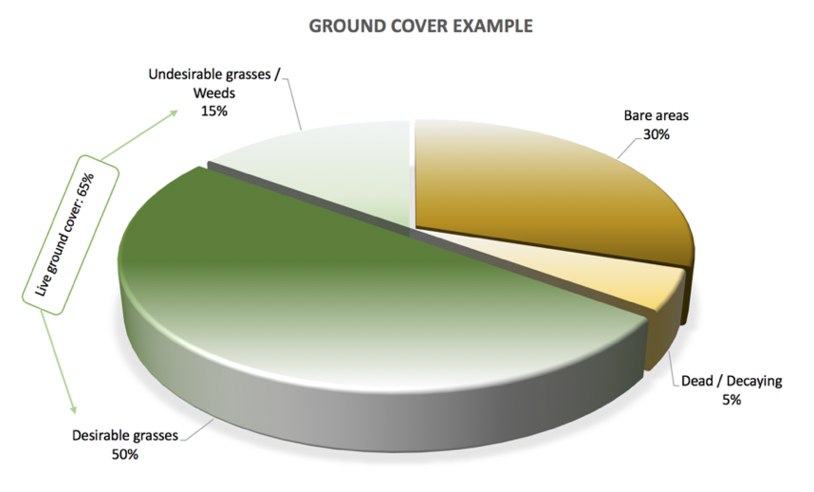
Important Note: All percentage values (except earthworm casts) relate to the total of ground cover being 100%. This means that the three main categories of live (which then consists of desirable grasses, undesirable grasses and weeds), dead/decaying, and bare areas, will all add up to 100%.

2 Example: The live ground cover might be assessed as being 65%, with the desirable grasses cover as 50%. This means that 50% of the total area being assessed is composed of desirable grasses.

It doesn’t mean that 50% of the total live ground cover is composed of desirable grasses, which would result in an incorrect 32.5% being recorded for the total area.

This is an important point to remember because it can be a common mistake to make. The following graphic illustrates this point.

Example of ground cover analysis

3   By carrying out routine and evenly spaced-out assessments a groundskeeper will be able to have valuable data that shows what is happening to the pitch and the type of trend that might be developing. Addressing a potential problem before it becomes an actual problem is one of the key benefits of this assessment approach.

If you wanted to do a more detailed pitch assessment, then double up your worksheet and use the following locations:

  • Location area number (L): Name of location area
  • L1: Goal area / penalty area A.
  • L2: Centre circle: A.
  • L3. Centre area: B.
  • L4. Centre circle: B.
  • L5. Wing A2.
  • L6. Wing B1.
  • P = Position 1, 2 or 3.
Module progress: 61%