Module 2:

Pitch quality

2.3 Assessing Pitch Quality

2.3.7 Performance Standards and pitch quality grades

1   Football pitches can come in all shapes and sizes, by this we really mean different types of quality, which can be grouped into five different grades (or levels) to help to better understand what might be needed to maintain them at a defined grade, as well as the expected levels of use, depending on the pitch construction and soil type.

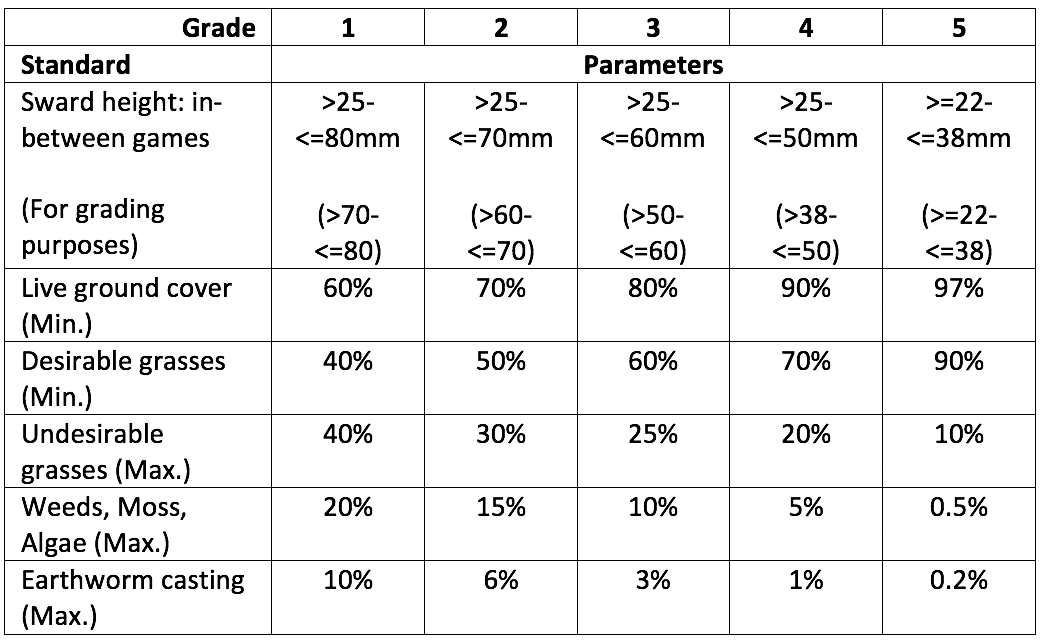
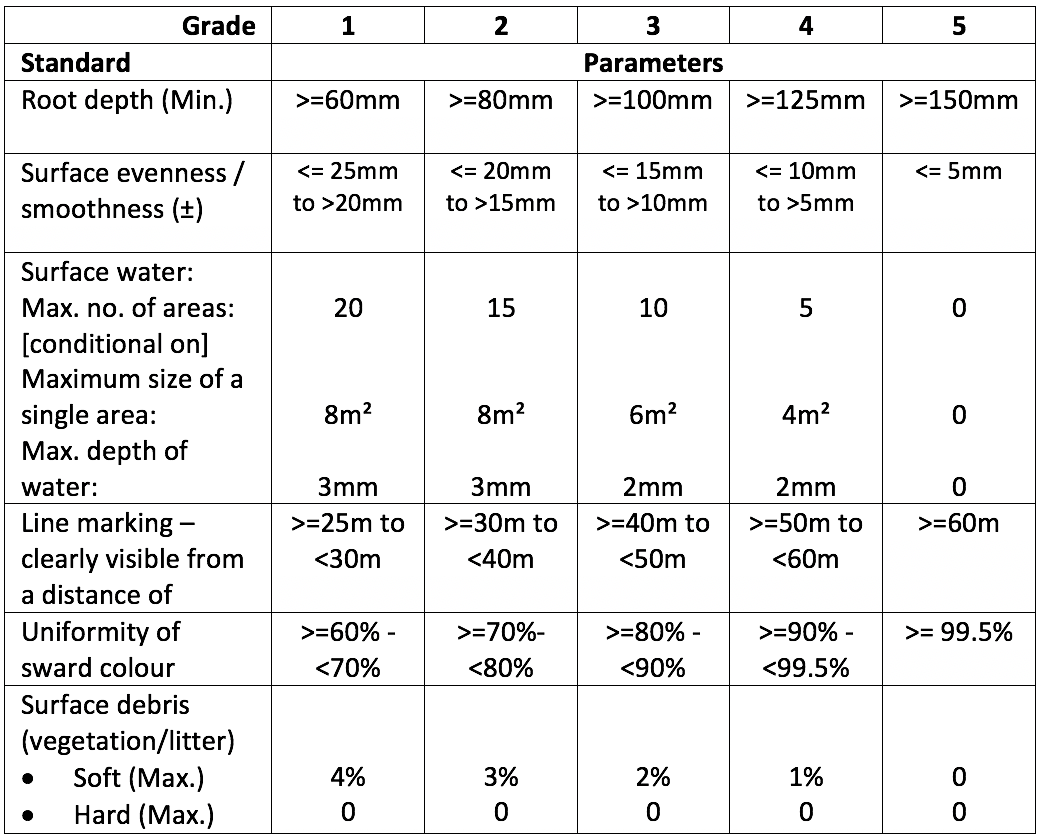
The following data table provides a snapshot of the 12 performance standards for the five different pitch grades. The values provided are only indicative of what might be encountered in practice, but for our purpose they help define clear boundaries between the different grades and this will allow us to provide an overall rating for the pitch being assessed.

2 Note: The values for performance standards can be quite arbitrary, so different authorities might have slightly different values to others. This isn’t an issue because there will be distinct boundaries between the different quality grades of pitch. There will always be debate and agreement or disagreement about where a particular boundary line should be set, but the important issue is that the quest of trying to maintain and manage an objectively defined football pitch in an effective and efficient way with available resources has been made clearer to a grounds manager.

Performance standards for Football pitches table A
Performance standards for Football pitches table B

3   Before we move on, let us just make sure we understand what the figures mean in this table.

Example 1: If we consider the Live ground cover figures first, what do these mean. Well, if we consider the Grade 2 column with a value of 70%; this means that a minimum live ground cover of 70% is required for a pitch to be graded as Grade 2 for this performance parameter. If the assessed figure was, for example, 86% then this would mean that the pitch would be graded as Grade 3 for this performance standard because the minimum value for this grade is 80%, but it isn’t quite high enough to reach a grade 4 pitch, which requires a minimum of 90% of live ground cover.

Example 2: Let us now look at the first performance standard in the table, which is sward / grass height in between games, meaning it isn’t the same as a performance standard we would be looking at for a prepared match, many of which would typically have a height of cut setting of between 25mm and 35mm.

4   So, if we look at the second column again, for a Grade 2 pitch, we see that the height is given as >25 to ≤70mm (greater than 25mm to less than or equal to 70mm), which is quite a wide range, but can be considered as typical for the many pitches that aspire to this grade. So long as the pitch is cut within these heights then that is suitable for a Grade 2 pitch, however, when we are carrying out a formal assessment for whole pitch grading purposes, we have made sure that the values for each Grade do not overlap, which they would otherwise do in practice.

If the pitch grass / sward height was measured as greater than 60mm yet less than or equal to 70mm, then it would be given a Grade 2 classification. Don’t forget that this is the maximum height at which it would be allowed to grow prior to being cut, not the height of cut setting.

Pitch quality assessment (and evaluation of the findings) is a comprehensive subject all by itself, so do treat this introduction as just a taster and it is something that would be covered in a lot more detail in another course.

Module progress: 70%